
We’re Building a Company Memory
And trying to make knowledge graphs cool again.

CEO Summary — what this system is and why it exists
The scoring system is our firm’s automated gut feel about every client, person, and project — built so the team’s attention automatically goes where it earns the most.
Every client carries two numbers. Credit (do they pay well, take fee and scope conversations gracefully, and are they good to work with — built from payments, invoice aging, email and call tone, and what our own team says privately) and Health (is the relationship warm and active — it decays a little every quiet day and recovers when we actually talk to them). Credit is uncapped: a client who pays four invoices the same day visibly pulls ahead of one who’s merely fine. Health stays 0–100.
Every person carries a warmth number (0–100), and every project carries a risk number built from the knowledge graph — open questions nobody answered, commitments we owe, risk flags, a struggling client, and cold people woven through the job. Old questions fade out of the score instead of inflating it forever, and a cold person tied to many of our jobs counts more than a one-job annoyance.
The highest-credit clients whose health is slipping, with whom we have the largest book of work, surface first — and within those clients, their most at-risk projects rise to the top.
Three rules keep it trustworthy. Every signal counts exactly once (no double-scoring). Conversations attach to a project first, and the project decides which client benefits — calling a third party like an architect no longer blindly credits whoever they’re globally linked to. And the AI only ever proposes; nothing moves a score from a knowledge-graph suggestion until a human accepts it, and every number is explainable and correctable from the screen it appears on.
Every dial is configurable at /settings/clients/score-settings, every change is audited, and build-time tripwires plus SQL regression tests keep anyone — human or AI — from quietly reading scores from the wrong place or re-introducing old math.
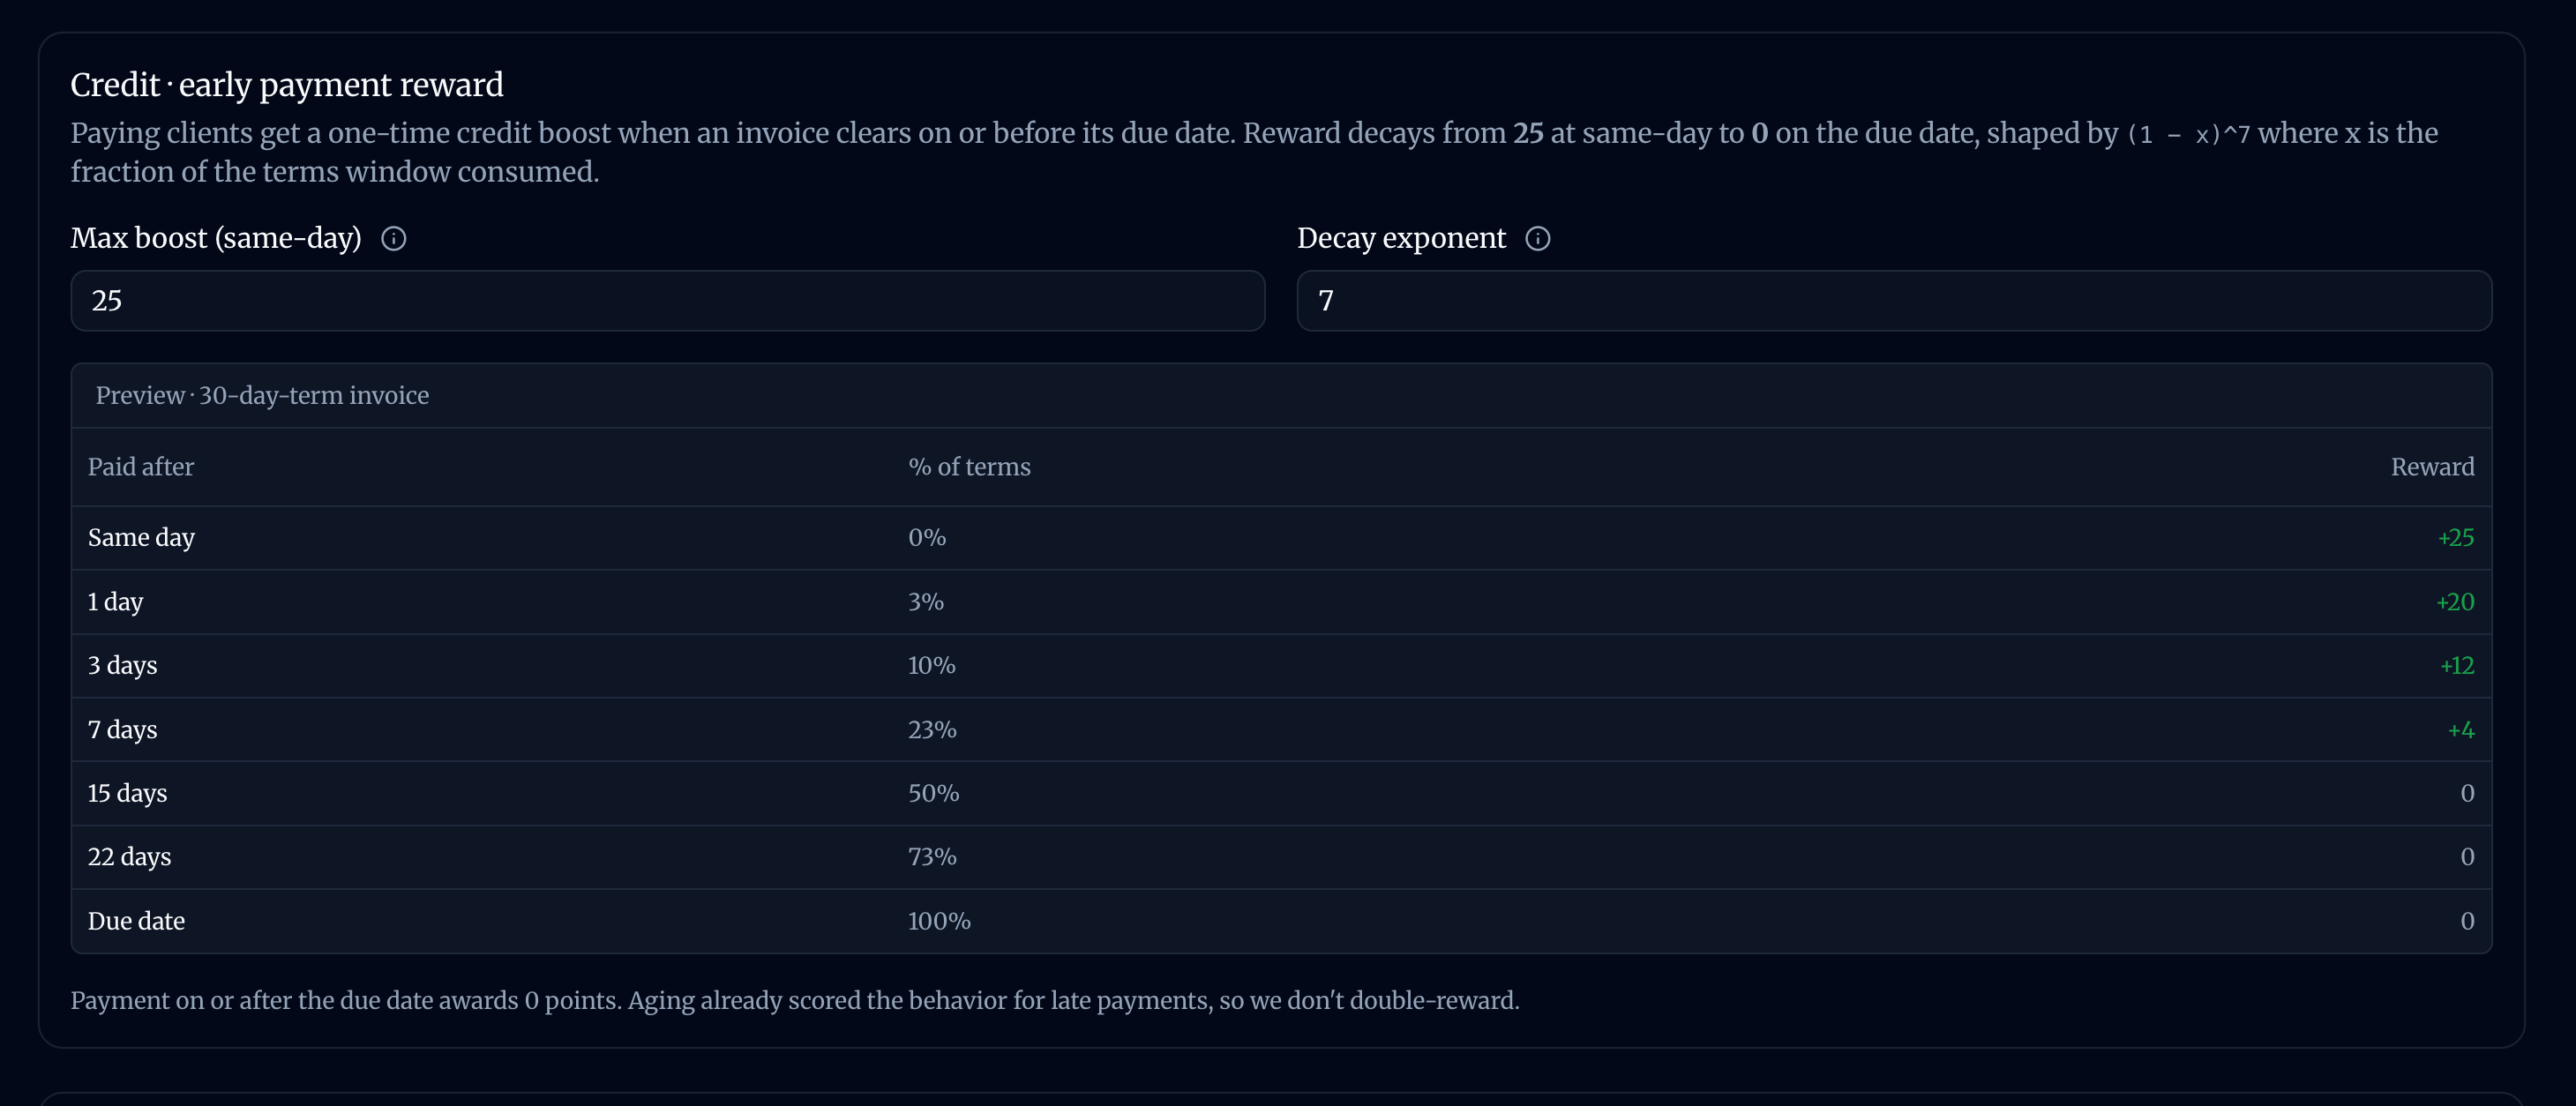
Paying early is rewarded.
Paying late is penalized.
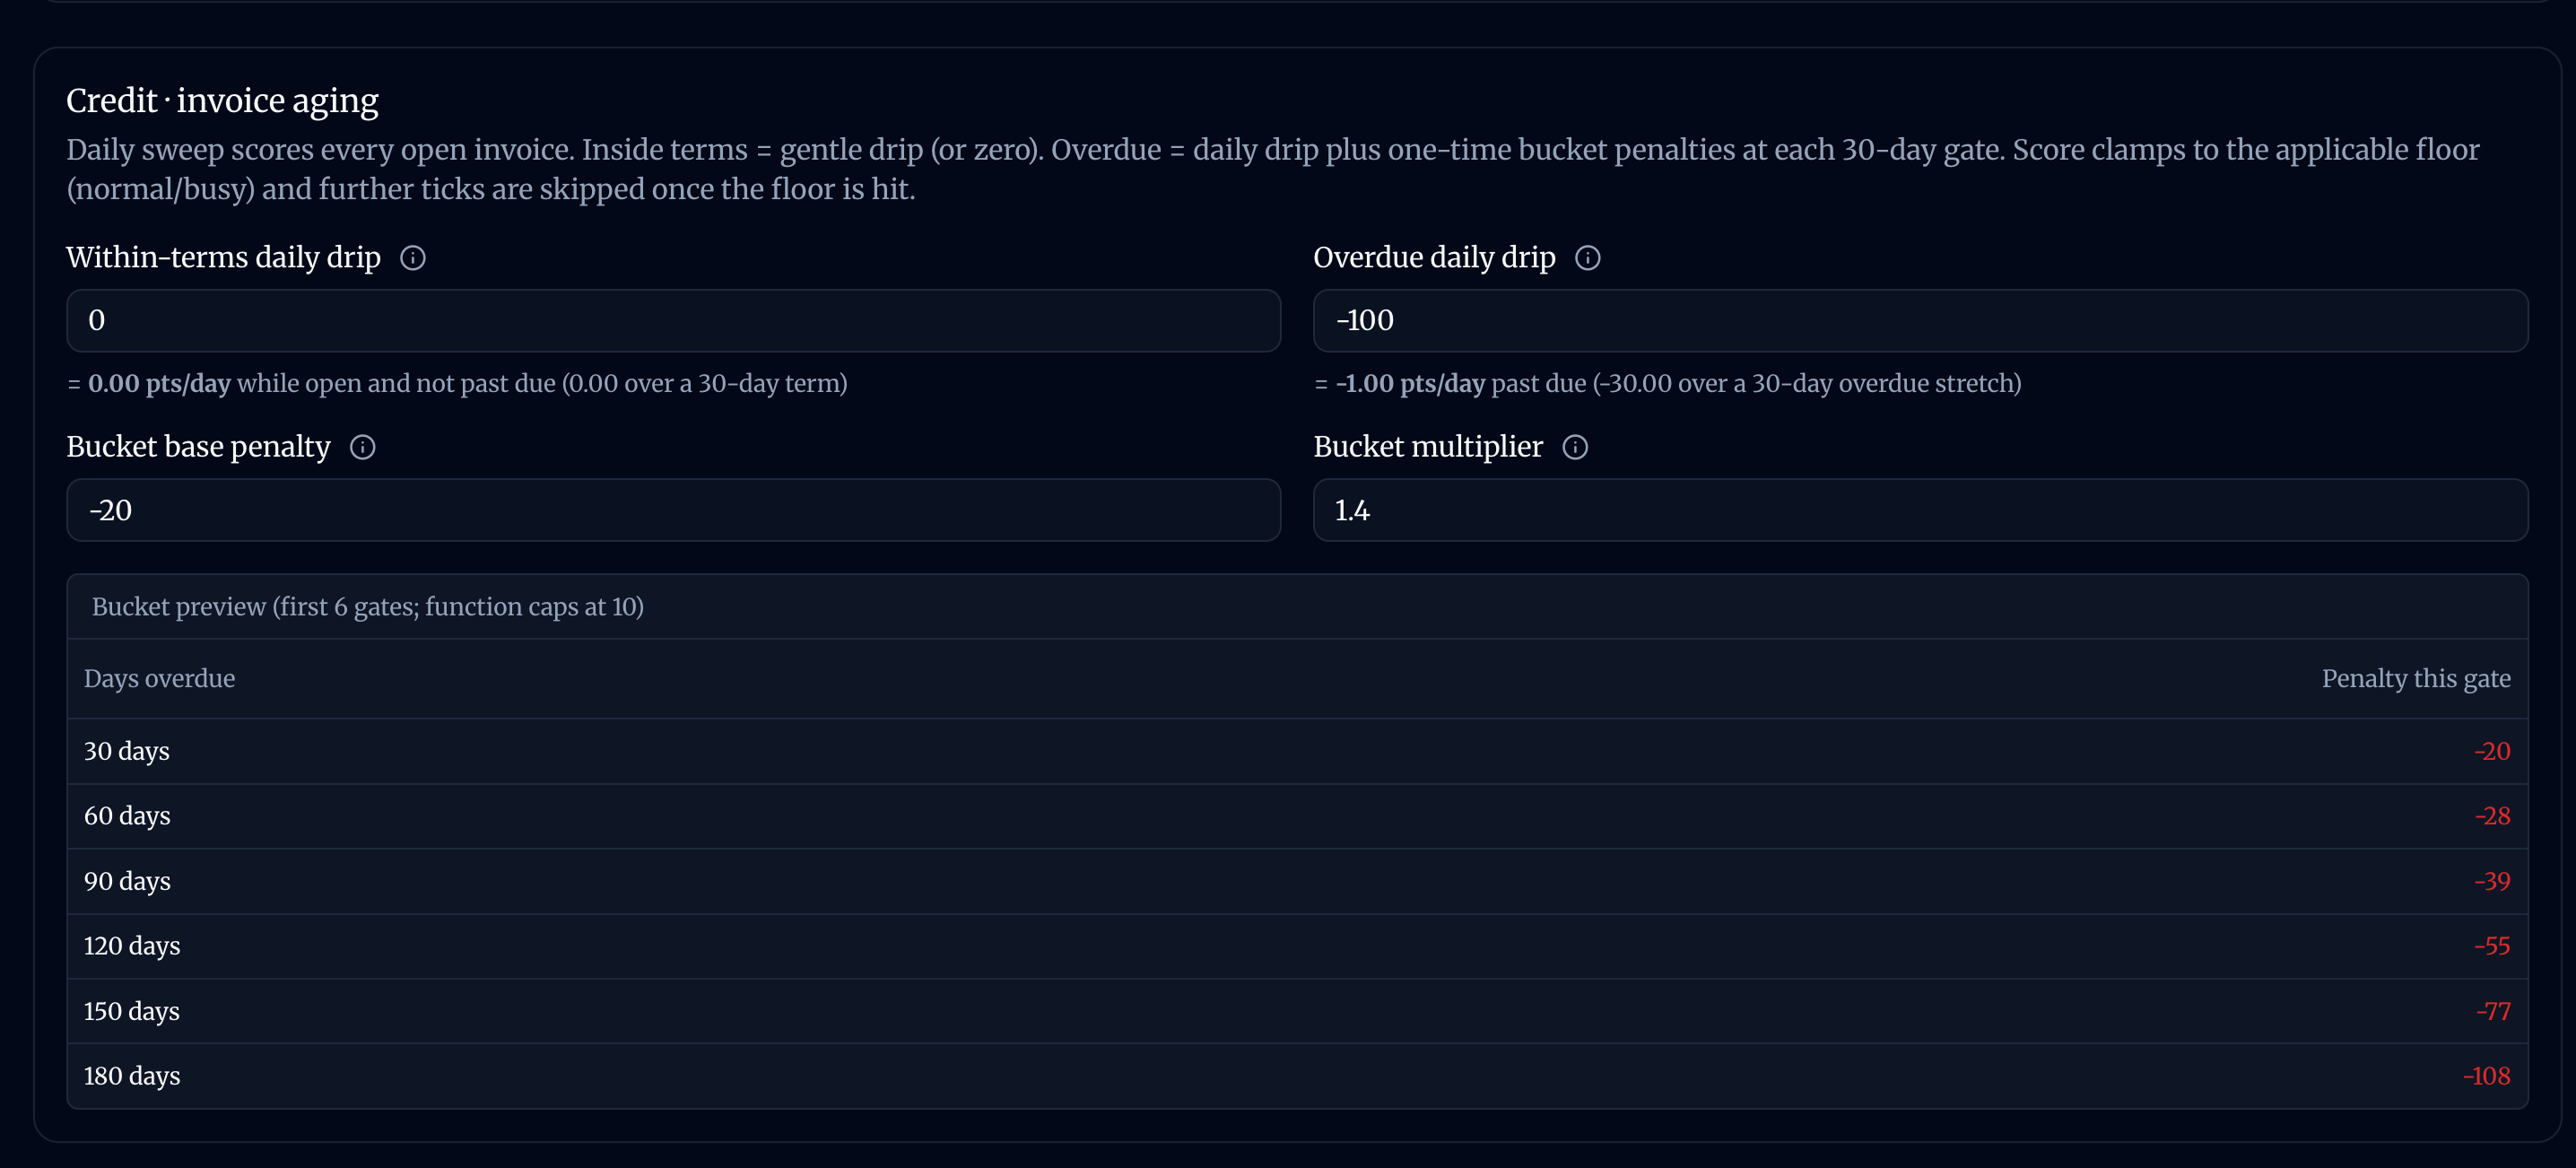
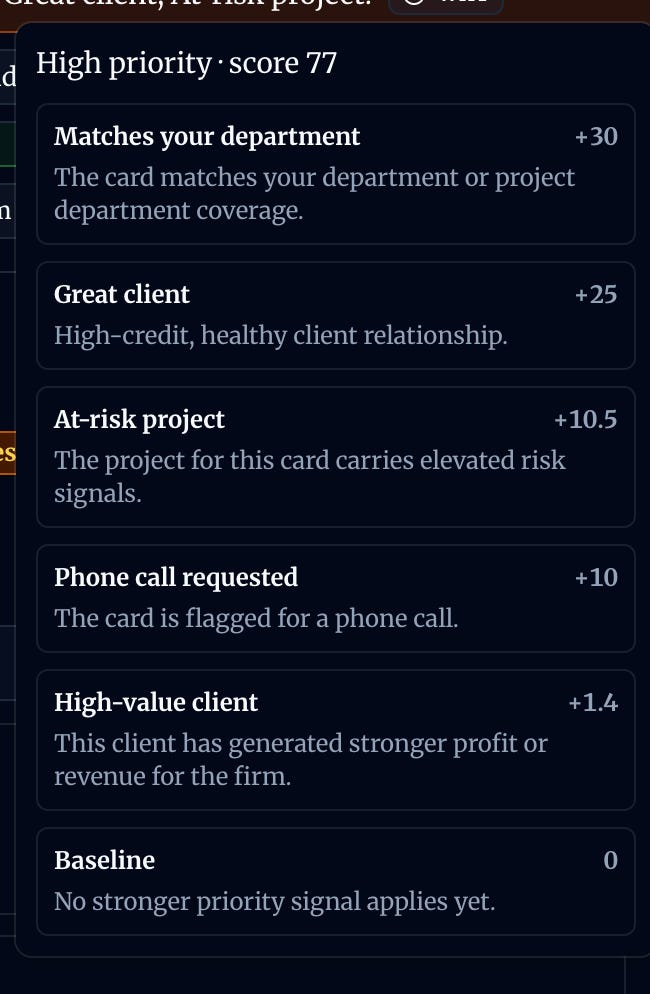
All weights are configurabe and are used to automatically prioritize our tasks.
How does the knowledge graph fit into all of this?
We’ve been experimenting with knowledge graphs at PermitZIP because engineering firms are full of context that disappears. Gathering the right information when you need it on a complex project has an impedance mismatch problem in our industry.
A project is not just a folder. It is a messy web of people, clients, contractors, emails, meetings, decisions, site visits, open questions, promises, risks, and history. Most firms carry that in people’s heads until someone is busy, out sick, leaves, or just forgets. Then everyone starts digging through email like archaeologists.
That is the problem we all are trying to fix. Procore probably did the first best job at helping to solve that. But now we have new frontier models that are making personal in-house Procore a reality for everyone with a Codex or Cowork subscription.
Our knowledge graph went live a couple months ago.
And it is already starting to change how we look at projects. It pulls together the normal trail of work: emails, meetings, project records, people, companies, documents, open questions, commitments, and risk flags.
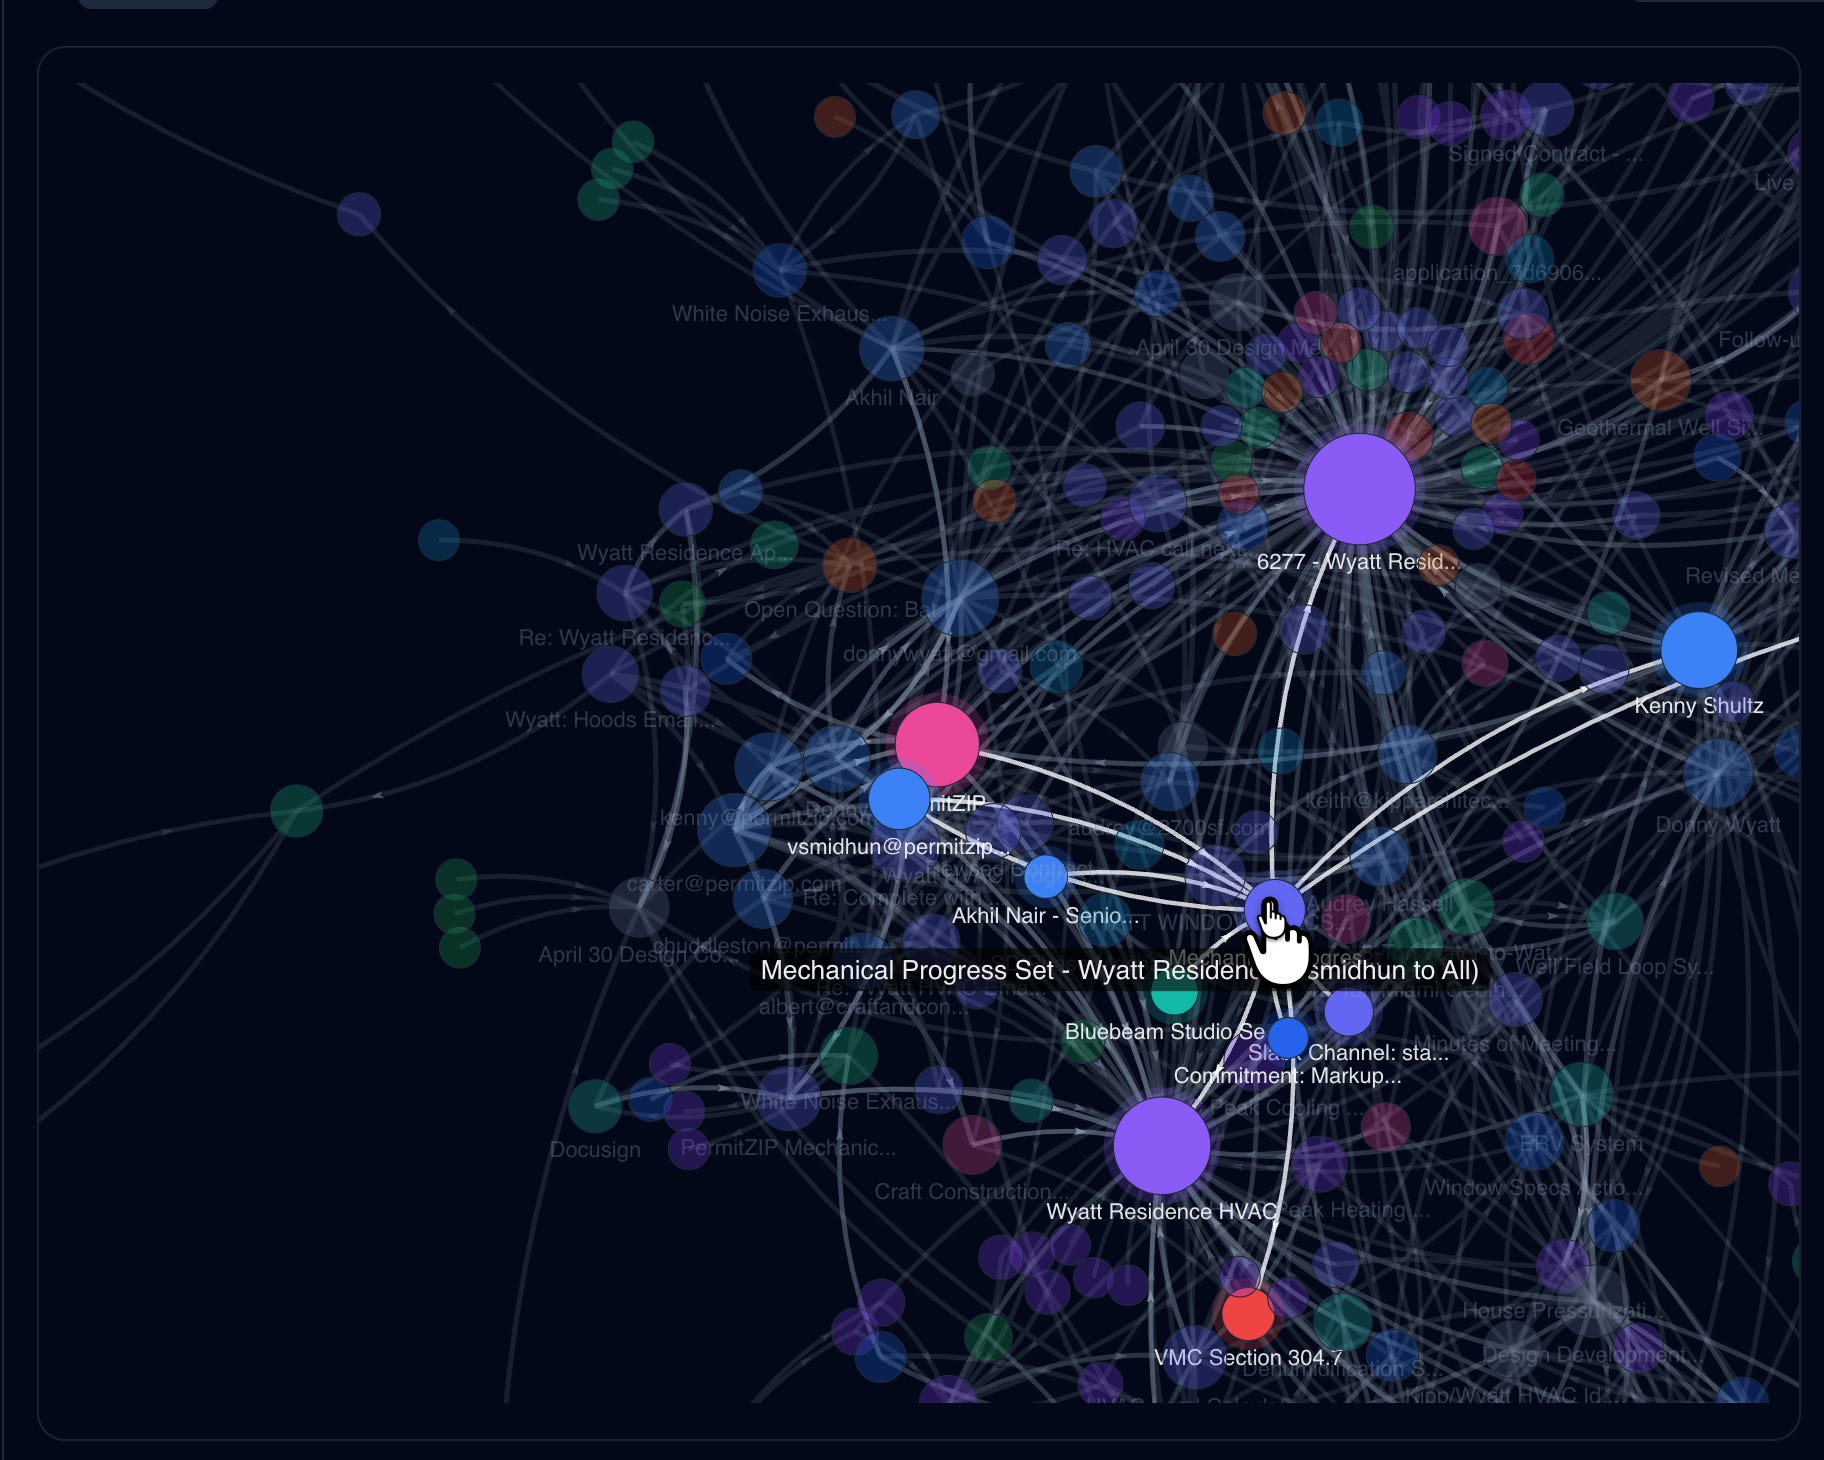
One project I keep coming back to is a complicated single family mega mansion on the beach. In the graph, you can see the project sitting inside a web of people, emails, meetings, documents, and unresolved issues. Our knowledge graph already had the information shown in image below (risk flags, open questions, open commitments). We are just associating a configurable point system to each of those. And calculating the risk for the project.
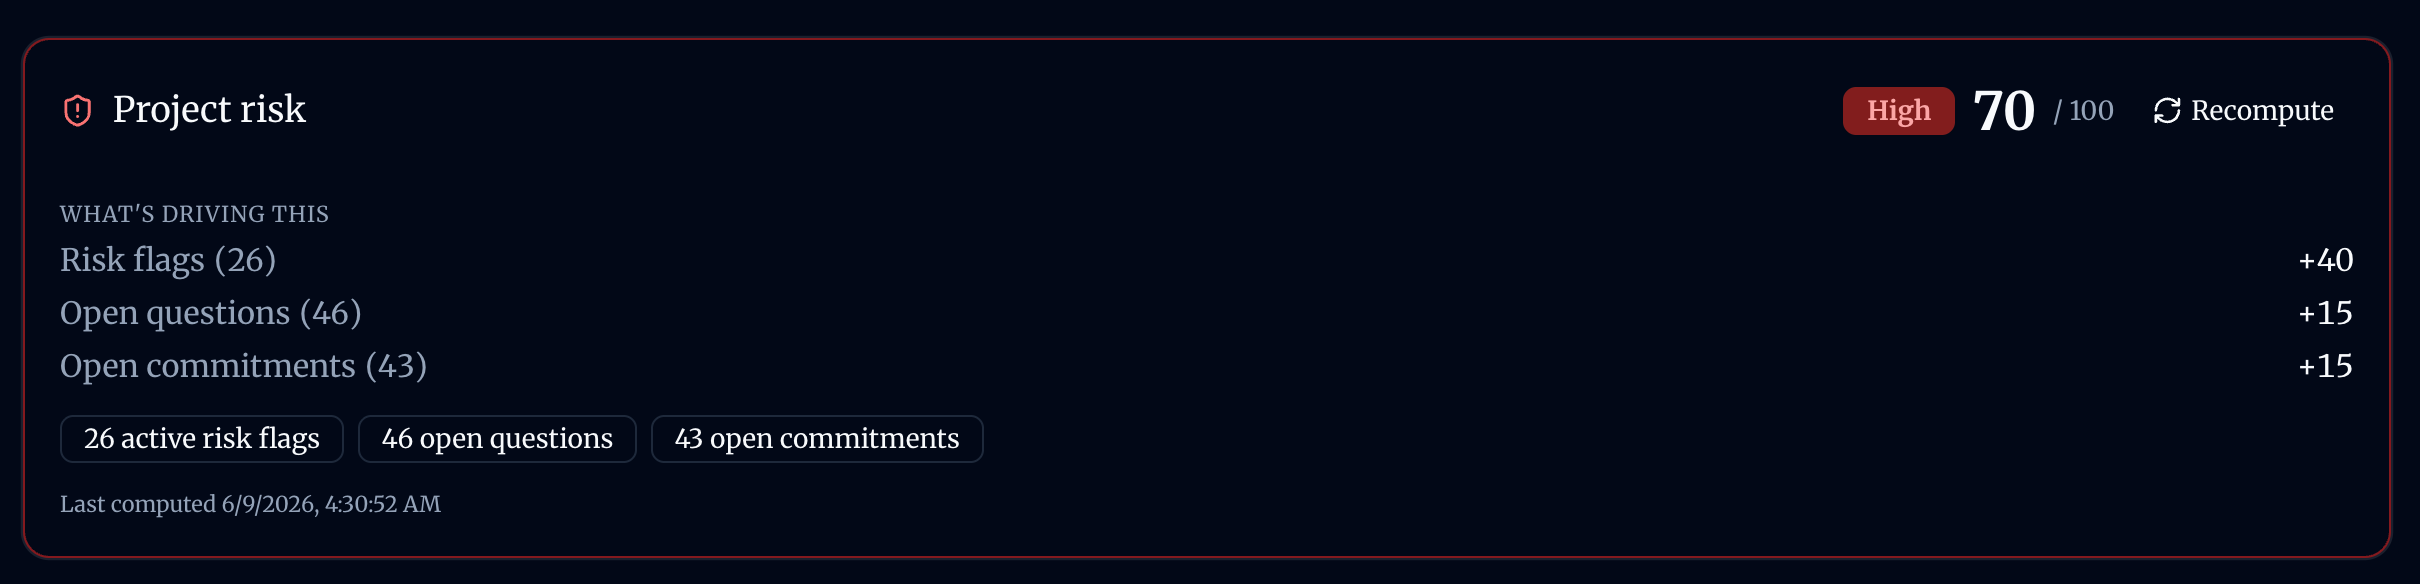
I can click to see the flags. I can disregard duplicated, or false or outdated information. But the signal is incredibly useful to us. We immediatley to go work on a project like this (for the fast paying clients that we like). The system is starting to show where the unresolved context is piling up.
What we’re learning
The graph is far from perfect. We’re actively monitoring, reseraching, and fine tuning how it works and what is classifies. Some signals are stale. Some things get counted wrong. Some relationships need cleanup. But even that is useful because now the mess is visible.
We are learning that emails, meetings, calls, comments, and project records should not all be treated the same. A one-hour meeting probably tells you more about project risk than a random email reply. A stale open question should not hurt a project forever. A client should not automatically get blamed for chaos caused by a contractor. A person with influence across five risky projects matters more than someone who was difficult once and is no longer active in the market.
PermitZIP is trying to make high-quality MEP engineering work on smaller commercial projects.
That means we deal with tight budgets, fast timelines, imperfect information, and a lot of coordination gaps. Those jobs can go sideways quickly if the firm is only reacting to inbox noise. We’re also dealing with a larger-than-average population of lower experienced players with expectations that are completely unrealistic (huge risk for everyone involved).
The graph gives us another way to ask better questions:
Which projects are quietly accumulating risk?
Which clients pay well but create a lot of drag?
Which contractors keep showing up near unresolved issues?
Which commitments are still open?
Which relationships are getting colder?
What is the chain of custody that lead to this decision?
Which project needs leadership attention before it becomes a fire?
It helps our firm remember what happened, connect the dots, and point us toward what matters.
Technically speaking, it’s used to pre-feed our agents with that information so they can produce more accurate results (very important when each run might cost $10 or more).
What I’d try if I worked at another firm
First I would make sure I have a Claude Cowork or OpenAI Codex subscription with extra usage turned on. If I couldn’t get that, I would quit and find another job that would. What kind of company today doesn’t provide these resources to their engineers?
Anyway, I would not start by building a platform. I would pick one painful operating problem and model that.
For example: “We lose track of open questions after meetings.” Or “We do not know which clients are actually profitable until too late.” Or “Our PMs remember relationship history, but the company does not.” Or “We cannot see which projects are getting risky until someone is already mad.”
Take ten projects. Pull together recent emails, meeting notes, project folders, client names, companies, open issues, and payment history if you have it. Then ask how those things should connect.
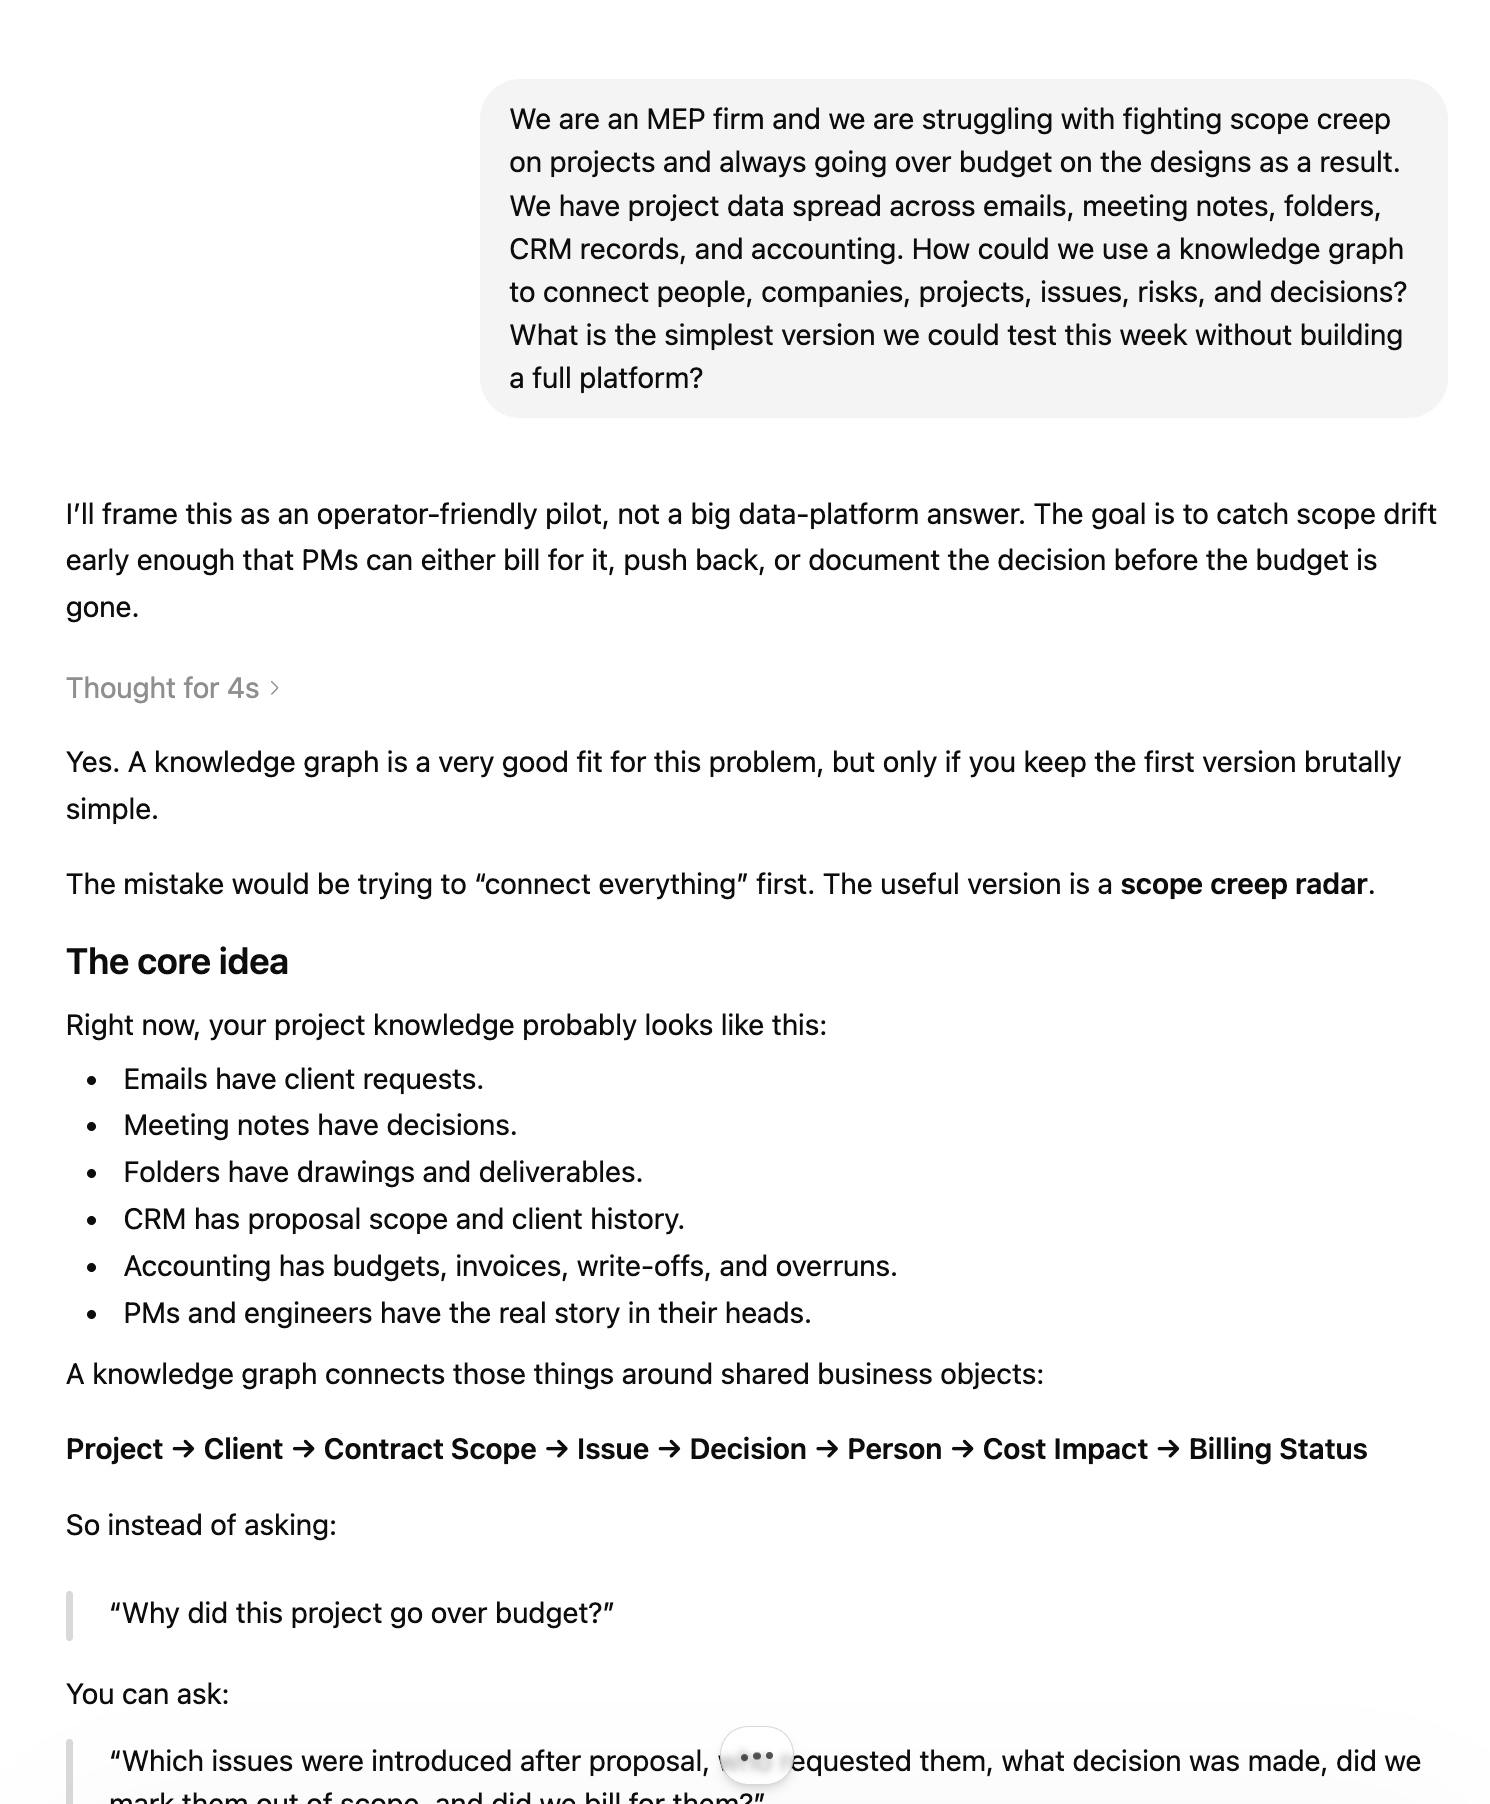
I’d head straight to Claude or ChatGPT and prompt something like:
We are a [type of firm] and we are struggling with [specific recurring problem]. We have project data spread across emails, meeting notes, folders, CRM records, and accounting. How could we use a knowledge graph to connect people, companies, projects, issues, risks, and decisions? What is the simplest version we could test this week without building a full platform?
The knowledge graph is useful because firms like ours run on context, and context is easy to lose.
We are trying to make that context visible. Who was involved. What was promised. What is still open. Where risk is building. Which relationships matter. Which projects need help.
It is early, imperfect, and very much still under construction. But it already gives us better questions than we had before.